Events
11 events found
- 1
- 2
Note, this map only displays events that have geolocation information in
TeSS.
For the complete list of events in TeSS, click the grid tab.
TeSS makes use of some necessary cookies to provide its core functionality. Additionally, we make use of Google Analytics to discover how people are using TeSS in order to help us improve the service. To opt out of this, choose the "Allow necessary cookies" option.
See our Privacy Policy for more information.
You can modify your cookie preferences at any time here, or from the link in the footer.
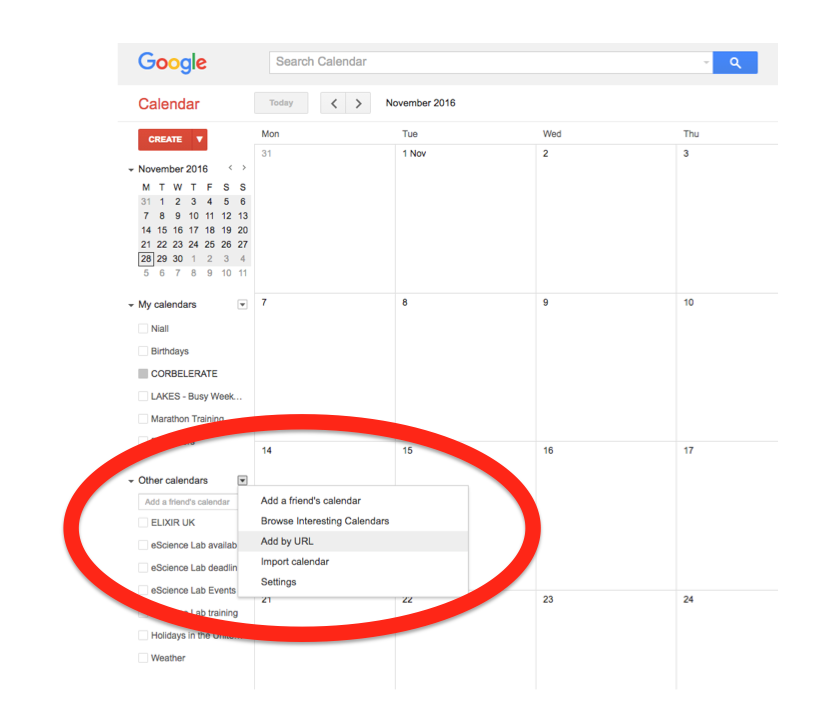
In the left-hand column of the Google Calendar main view, click the arrow to the right of "Other calendars" and click "Add by URL". In the form that appears, paste in the URL from the box above, and click the button to confirm.
Please note, it may take a while for newly created events in TeSS to synchronise with your Google Calendar.
4 April 2023 @ 10:00 - 12:00
Online
Data visualisation Data management18 April 2023 @ 10:00 - 12:00
Online
Data visualisation Data management9 November 2023 @ 10:00 - 12:00
Online
Data Visualization Data visualisation14 November 2023 @ 09:00 - 12:00
Tartu, Estonia
Face-to-face
Data visualisation Data visualization RStudio ggplot25 April 2024 @ 14:00 - 16:00
Online
Data visualisation Data Visualization data visualisation Data visualization12 April 2024 @ 12:00 - 14:00
Tartu, Estonia
Face-to-face
Data visualisation Data Visualization Data visualization data visualization data visualisation Tableau18 April 2024 @ 14:00 - 16:00
Tallinn, Estonia
Face-to-face
Data visualisation Data Visualization Data visualization data visualization data visualisation19 April 2024 @ 09:00 - 13:00
Tallinn, Estonia
Face-to-face
Data visualisation Data Visualization Data visualization data visualization data visualisation RStudio R ggplot23 October 2024 @ 09:00 - 17:00
Online
Data visualisation Data Visualization Data visualization data visualisation9 October 2024 @ 09:00 - 17:00
Tartu, Estonia
Face-to-face
Data visualisation Data Visualization Data visualization R RStudio data visualisation data visualization ggplot2
Note, this map only displays events that have geolocation information in
TeSS.
For the complete list of events in TeSS, click the grid tab.